


3D deformation monitoring array manufacturer
Category:
Instrumentation/Special instruments and meters/hydrologic apparatus
Model:
HR-1010
Brand:
Hengrui
Retail Price
99.00USD
重量
kg
- Product Description
-
Description :
1. Product Introduction 1
1.1. Product Introduction 1
1.2. Product Features 1
1.3. Technical Parameters 2
1.4. Industry Applications 2
2. Product Connection 3
2.1. Power interface 3
2.2 RS485 interface 3
2.3. Trigger Signal 3
2.4. Regarding lightning protection 3
3. Communication Protocol 4
4. Use of supporting software 4
4.1. Parameter Configuration 4
4.2.3D Display 5
4.3. Timed Collection 6
5. Attachment 7
5.1.HR-1010 Communication Protocol and Example 7
5.2 CRC Check Function 9
1. Product Introduction
1.1. Product Introduction
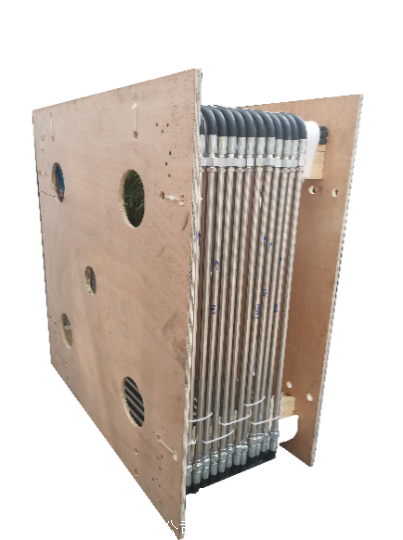
HR-1010 3D Deformation Monitoring Array (abbreviated as HR-1010) is a new, intelligent, and adaptable 3D deformation monitoring sensor for various industry applications. It is mainly used for comprehensive deformation (displacement) measurement in 3D space. The core technology of sensors has been maturely applied in multiple monitoring fields, and the data accuracy and stability have been rigorously verified;
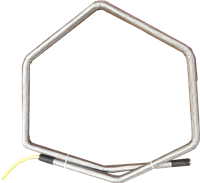
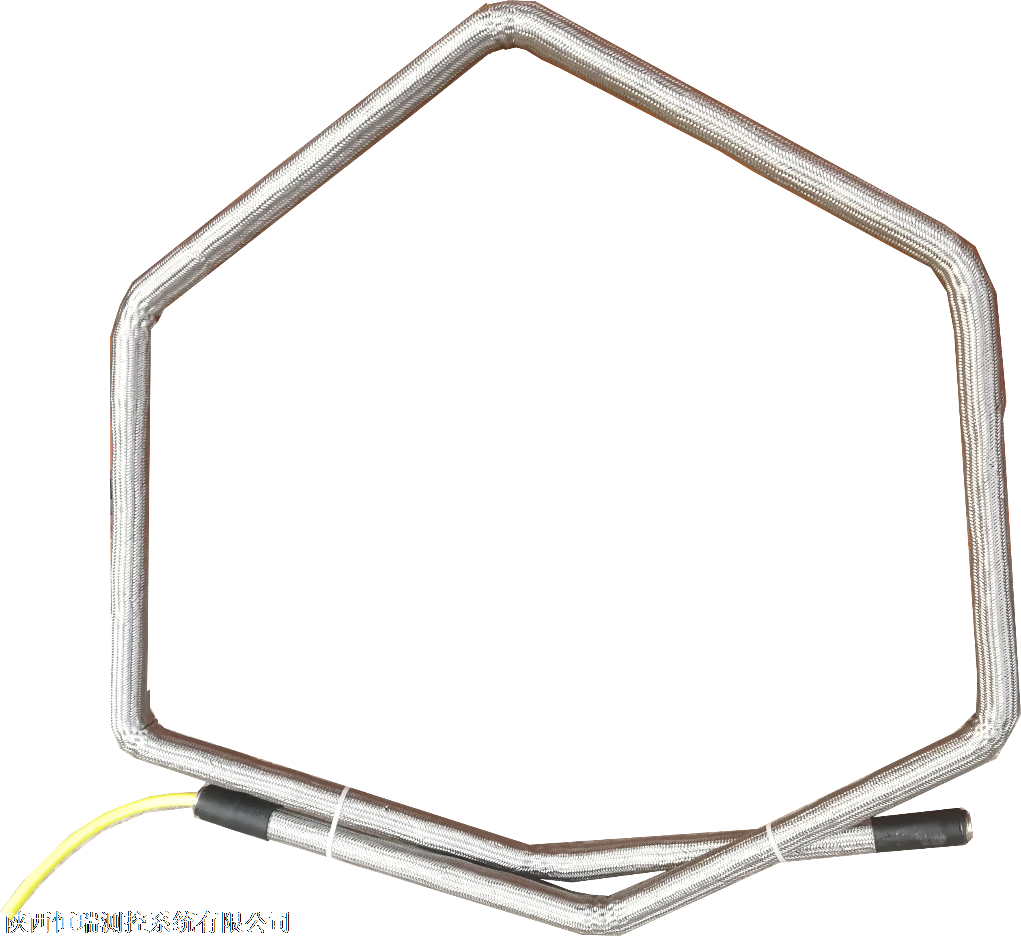
HR-1010 adopts multiple displacement sensors connected in series internally, which can be bent as needed to meet the monitoring needs of special scenarios;
HR-1010 integrates a data acquisition module internally, which completes data acquisition and calculation, directly outputs monitoring point coordinates without the need for external data calculation, and can select multiple monitoring parameters such as output angle, vibration frequency, amplitude, temperature, etc; The external interface adopts RS485 or RS232 standard interface, which can be connected to various data acquisition devices or directly connected to communication terminals, making it very convenient for integrated applications;
HR-1010 adopts multiple filtering algorithms and the self-developed SmaHR Data Select mathematical model, which enables HR-1010 to have both ultra-high precision and ultra fast response speed;
HR-1010 is equipped with a threshold comparison unit. When the collected data exceeds the threshold, it can immediately report the data or output a trigger signal through the trigger interface to wake up external devices for data reading, improve real-time data collection, and reduce the power consumption of data collection equipment on duty;
HR-1010 has multiple length specifications to meet the application needs of different industries;
HR-1010 can provide a 3D JS platform SDK development package, compatible with Java, Python and other platforms for secondary development;
1.2. Product Features
Measure deformation (displacement), inclination, vibration frequency, and amplitude in three-dimensional space;
Ultra low power consumption, with single section power consumption less than 1.8mA@12V Power supply;
Ultra large range, bending at any angle within a 360 ° spatial range;
Internal threshold control reporting, recording monitoring data at the moment of movement to improve data effectiveness;
Internal voltage and temperature acquisition function, abnormal alarm function;
High integration, internal integration of data acquisition and operation modules, direct output of spatial coordinates without external calculation, easy to integrate;
Communication interface: RS485 interface/RS232 interface;
The working temperature range is -40 ℃ to+85 ℃, with automatic temperature compensation;
Power anti reverse connection function;
The lightning protection and anti-static performance of? (± 60kV/600W);
Wide voltage power supply: DC 5-30V power supply range;
Sealing grade: IP68;
Water pressure resistance: Standard version 2MPa (200m water pressure);
High water pressure resistant version 4.5MPa (450 meter water pressure)
3D display software for upper computer, visually displaying test results;
Multiple length specifications to adapt to different installation environments.
1.3. Technical parameters
Measure the three-dimensional dimensions of X, Y, and Z directions
Single section length 25cm/50cm/100cm/supports customization
Length 25cm/section 100m
50cm/section 200m
100cm/section 400m
Angle range 360 °
Resolution 0.001 °
Accuracy 0.005 °
Vibration frequency range 0-128Hz
Resolution 1Hz
Accuracy 1Hz
Displacement resolution 0.01mm
Stability better than ± 0.5mm@50m
Temperature resolution 0.1 ℃
Accuracy of 0.5 ℃
Supply voltage DC 5-30V
Power consumption ≤ 1.8mA@12V /Node
Hardware interface RS485 interface or RS232 interface
The communication protocol can directly read coordinates, temperature, voltage, etc
External dimensions of 30mm
Product material: 304 stainless steel, high-strength waterproof sealing pipe
Product weight 0.6Kg/section
Working temperature -40 ℃~+85 ℃
Protection level IP68
Water pressure resistance standard version 2MPa (200 meters depth)
High pressure version 4.5MPa (450 meters water depth)
1.4. Industry Applications
Tunnel convergence;
Settlement monitoring;
Bridge monitoring;
High rise buildings;
Dam monitoring;
Landslide monitoring.
2. Product Connection
The sensor leads out 5 cables, each with ± 60kV/600W static electricity, surge, and lightning protection. The power interface has anti reverse protection, fully ensuring the safety of the sensor itself. To ensure the normal use of the sensor, please carefully check the wire sequence before powering on. The wire sequence is as follows:
2.1. Power interface
The sensor adopts a wide voltage power supply method, with a power supply voltage range of DC 5-30V and anti reverse connection function.
Note: When the sensor length exceeds 50 meters, it is recommended to supply power in the 12-30V voltage range.
2.2 RS485 interface
The sensor communication interface adopts standard RS485 hardware interface, which can be connected to star or chain networks;
Under the condition that the number of sensors connected to the RS485 bus does not exceed 20 and the wiring length does not exceed 200 meters, it can be directly integrated into the RS485 bus network without the need for bus matching measures.
2.3. Trigger signal
The sensor can output a trigger signal when the tilt angle or vibration frequency changes. The trigger signal line adopts open drain output to be compatible with the IO port level (2.5V-12V) of the data acquisition terminal interrupt interface. The schematic diagram of the interface circuit is as follows:
2.4. Regarding lightning protection
The sensor is completely isolated from the outside, with an impedance greater than 100 megaohms, and does not require separate grounding. In addition, when wiring, the RS485 interface of the sensor and the data acquisition terminal can be considered to be grounded together to enhance lightning protection performance.
3. Communication Protocol
The sensor communication protocol can be found in Attachment 5.1.
4. Use of supporting software
The 3D deformation analysis management software is designed to be used in conjunction with sensors and mainly has the following functions:
Can set all sensor parameters, including sensor address settings, etc
Can be used for 3D display of sensors;
Can perform real-time data collection, report display, and data export;
Can query sensor information, including sensor node length, etc
Can perform initial position calibration after installation;
Default configuration for sensor serial port: baud rate: 115200, data bit: 8-bit, stop bit: 1-bit, checksum: none.
4.1. Parameter Configuration
By using the 3D deformation analysis management software, all sensor parameters can be set, as shown in the following figure. When multiple sensors are connected, address settings can be made.
main software interface
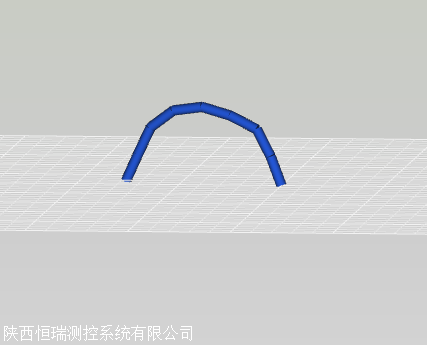
4.2.3D Display
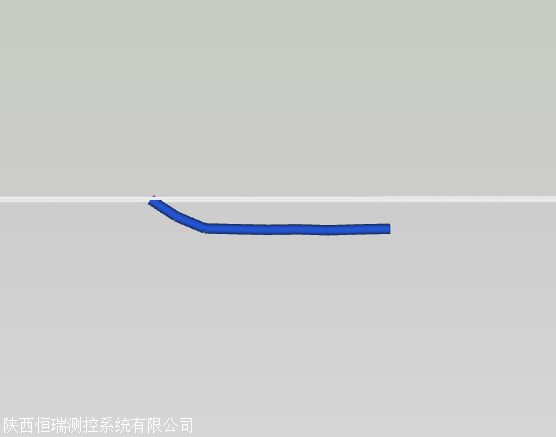
In the 3D display area, after enabling the 3D display function, the sensor posture will be displayed in real-time for sensor performance evaluation, as shown in the following figure:
Unstable slope monitoring
Horizontal settlement monitoring
Tunnel convergence deformation monitoring
The 3D display area can be freely dragged and dropped, allowing for the observation of sensor posture from any angle in three-dimensional space.
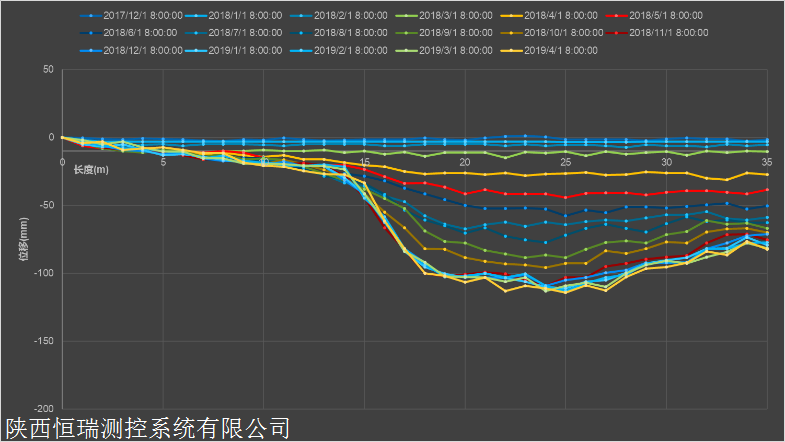
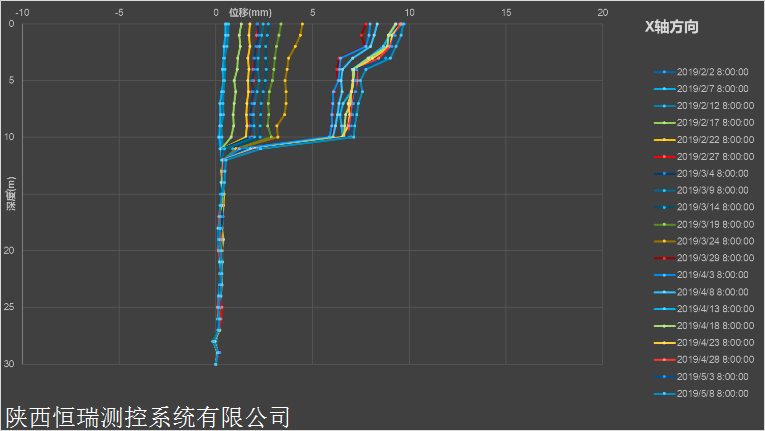
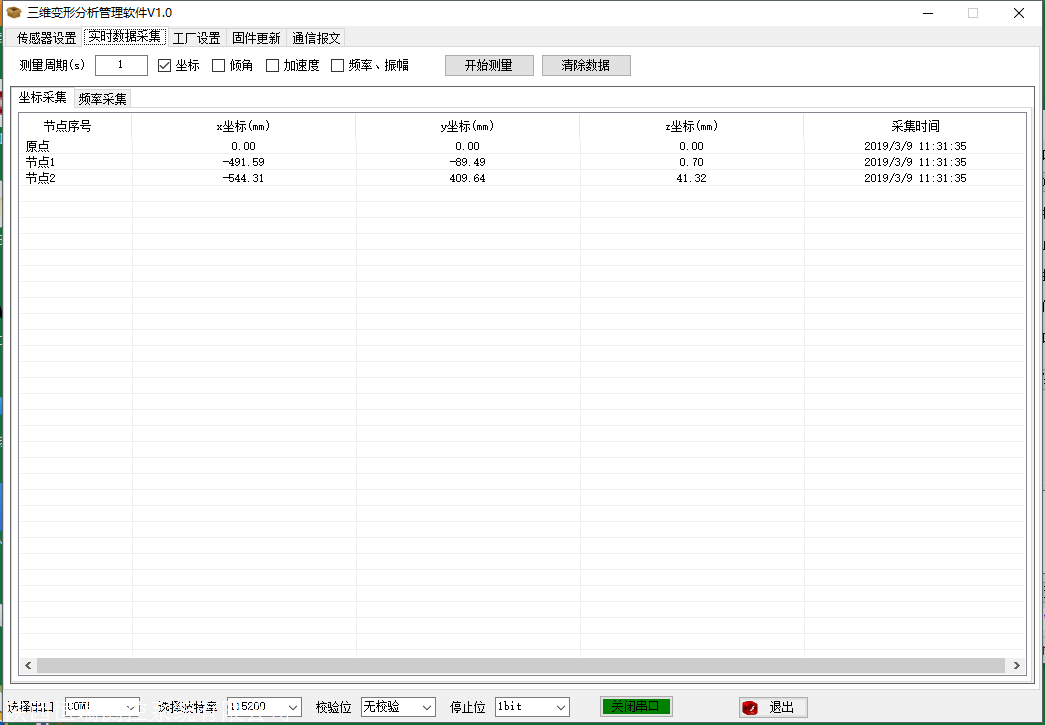
4.3. Timed Collection
Under the real-time data collection tab, the collection period can be set to collect the coordinates, inclination angle, frequency, and amplitude of sensor nodes at regular intervals for testing the accuracy and stability of the product, as shown in the following figure:
Data report display
AfterSalesService :
Key words:- 3D deformation monitoring array
More Products


